Basic-Use
Basic-Use.RmdSimple Depiction
A simple wrapper around cdk’s excellent depict module.
library(depict)
library(magrittr)

# load a smiles string
pen  <- parse_smiles("CC1(C(N2C(S1)C(C2=O)NC(=O)CC3=CC=CC=C3)C(=O)[O-])C penicillin")

# `depiction` is the base class; styles are applied to it
# `depict` applies the styles to the molecule
depiction() %>%
  depict(pen) %>%
  get_image() %>%
  grid::grid.raster()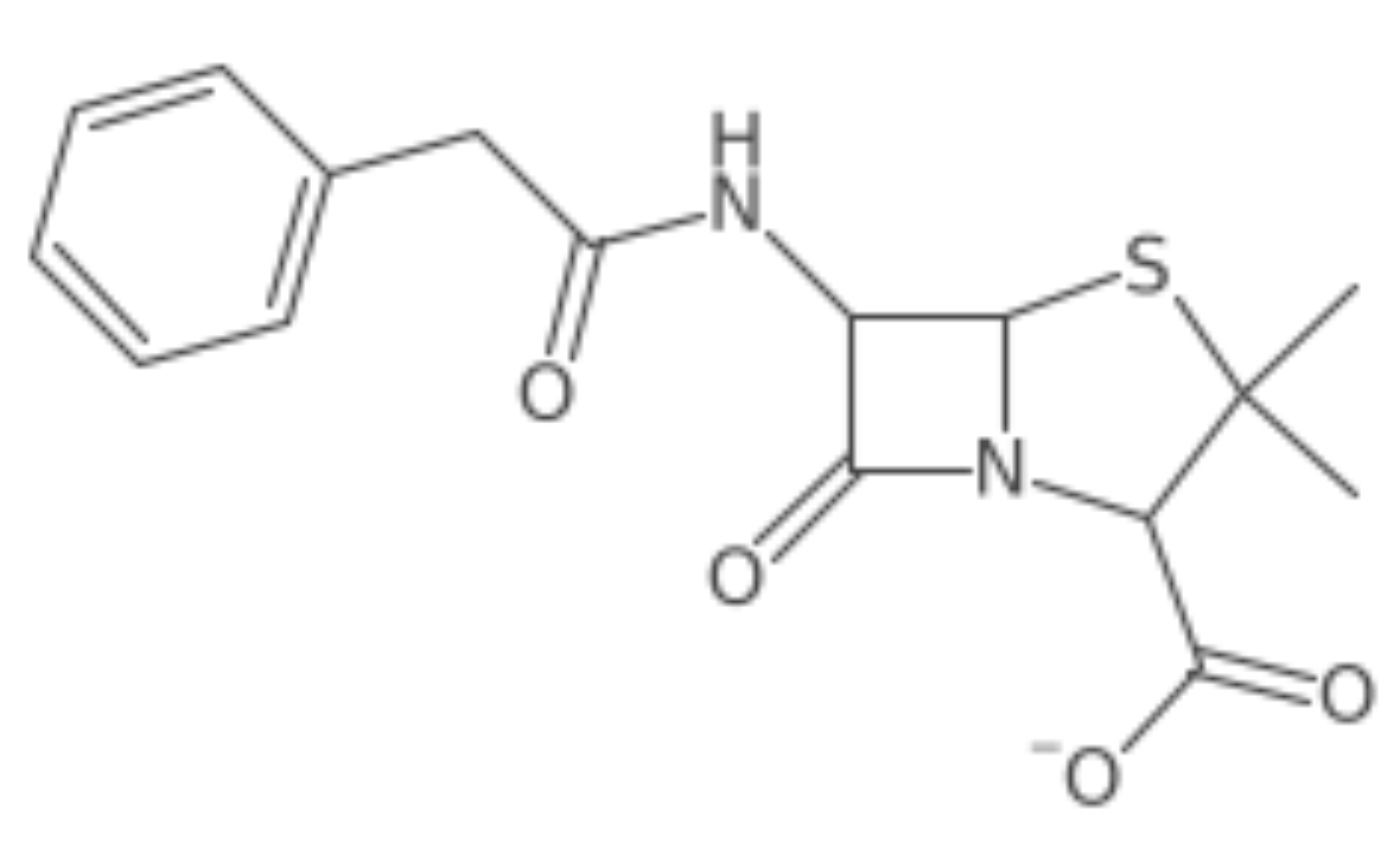
Multiple Smiles
# load a few smiles as AtomContainers
atmcontainers <-  purrr::map(
  c("CCCC", "CCCCCC", "CCCC1CCC1CC2CCCC2"),
  parse_smiles)

# convert them into a java iterable
many_containers <- atomcontainer_list_to_jarray(atmcontainers)


depiction() %>%
  set_zoom(10) %>%
  depict(many_containers) %>%
  get_image() %>%
  grid::grid.raster()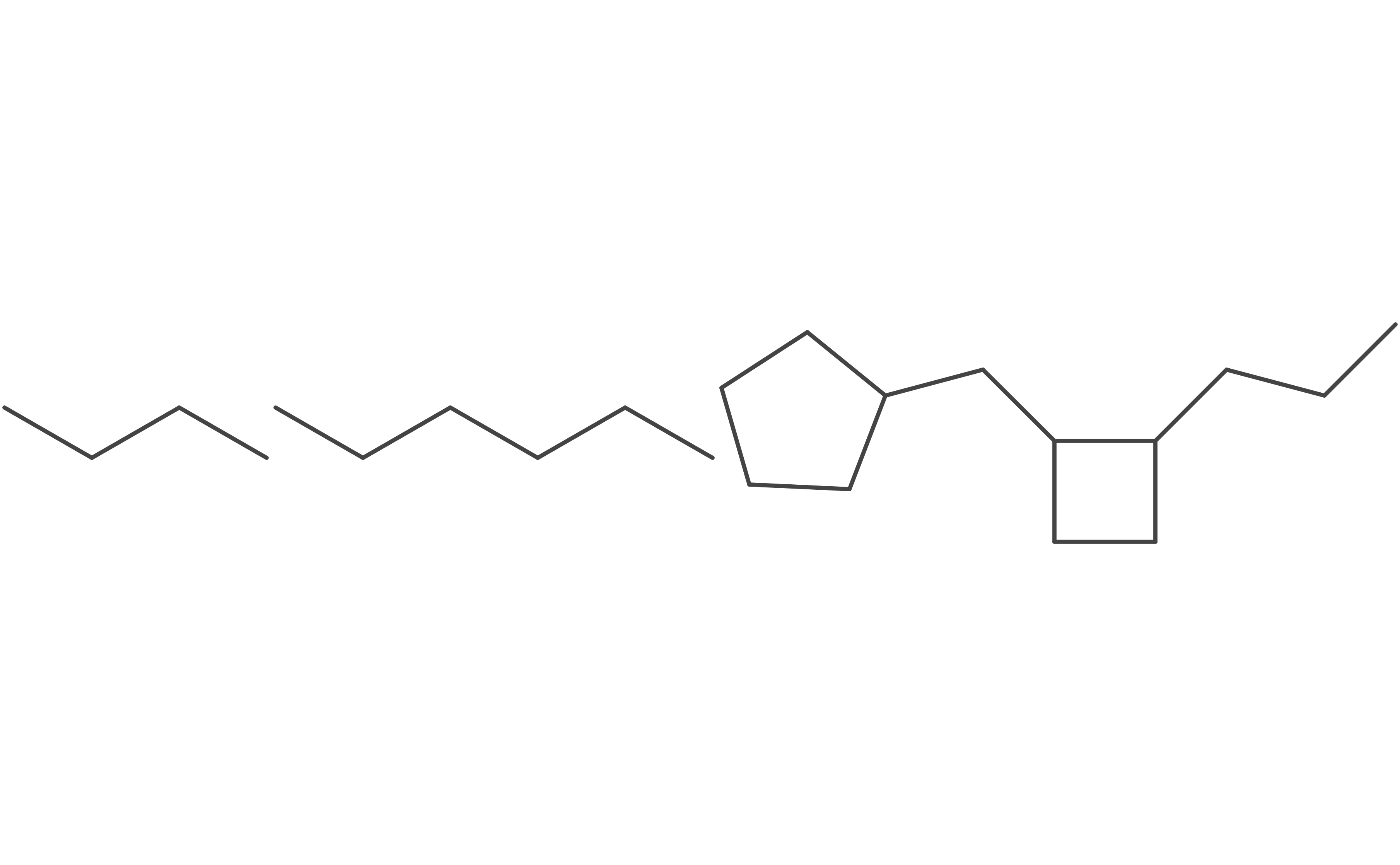
Use Colors, SMARTS, Highlighting
# you must supply java colors
color <- J("java.awt.Color")

# load in penicillin
pen  <- parse_smiles("CC1(C(N2C(S1)C(C2=O)NC(=O)CC3=CC=CC=C3)C(=O)[O-])C penicillin")
cav  <- parse_smiles("CN1C=NC2=C1C(=O)N(C(=O)N2C)C")

# define the regions to highlight
# either all atoms/bonds
# or a SMARTS-defined subregion
atms <- pen$atoms()
bnds <- pen$bonds()
lactam <- match_smarts("C1(=O)NCC1", pen)

# use piping to change the behavior as desired
depiction() %>%
  highlight_atoms(atms, color$LIGHT_GRAY) %>%
  highlight_atoms(bnds, color$LIGHT_GRAY) %>%
  highlight_atoms(lactam, color$RED) %>%
  set_size(400, 400) %>%
  set_zoom(3) %>%
  outerglow() %>%
  add_title() %>%
  depict(pen) %>%
  get_image() %>%
  grid::grid.raster()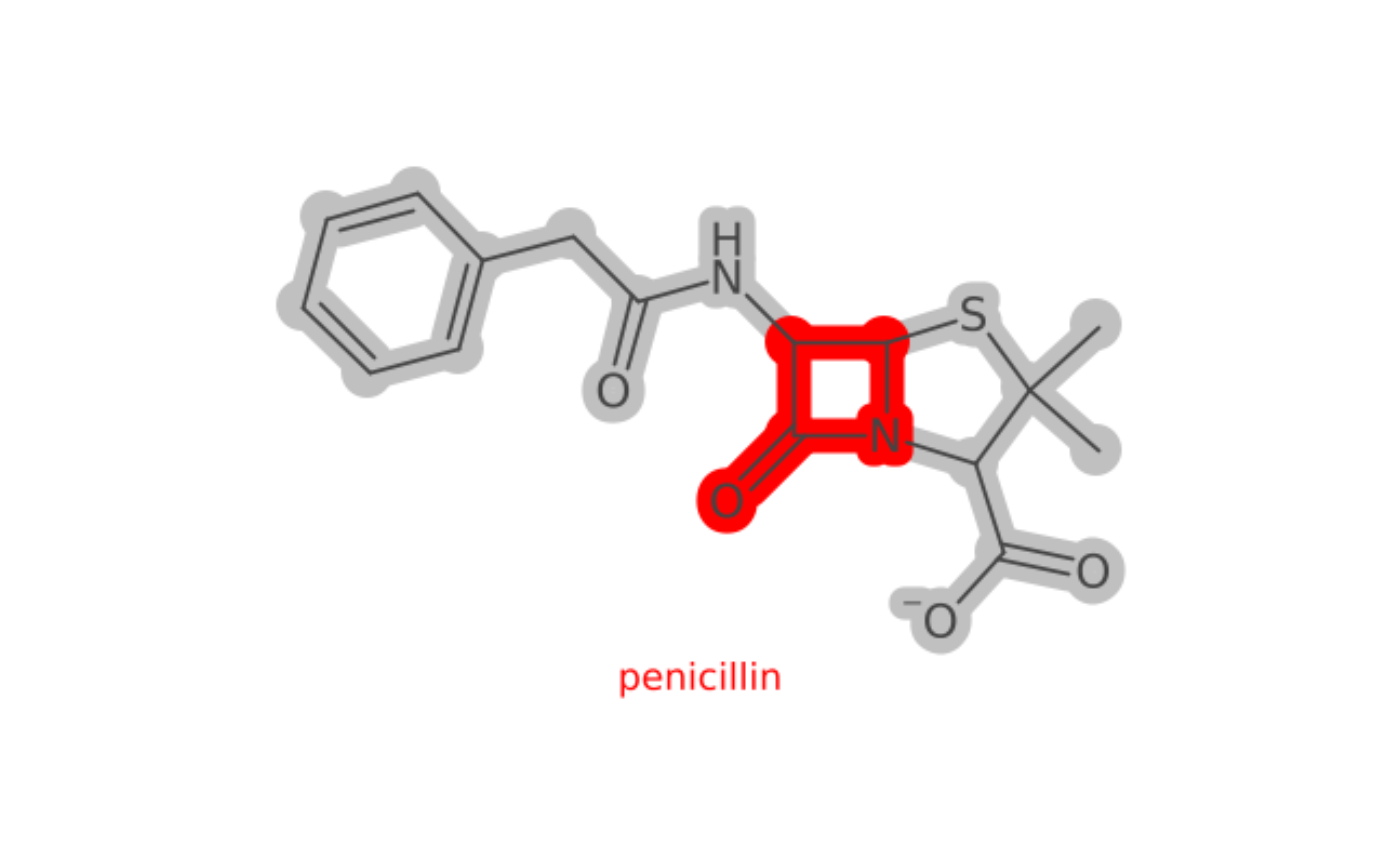
SMARTS for highlighting mutiple containers
small_highlight <- match_smarts("C1CCC1", many_containers)

depiction() %>%
  highlight_atoms(small_highlight, color$RED) %>%
  set_size(400, 400) %>%
  set_zoom(3) %>%
  outerglow() %>%
  add_title() %>%
  depict(many_containers) %>%
  get_image() %>%
  grid::grid.raster()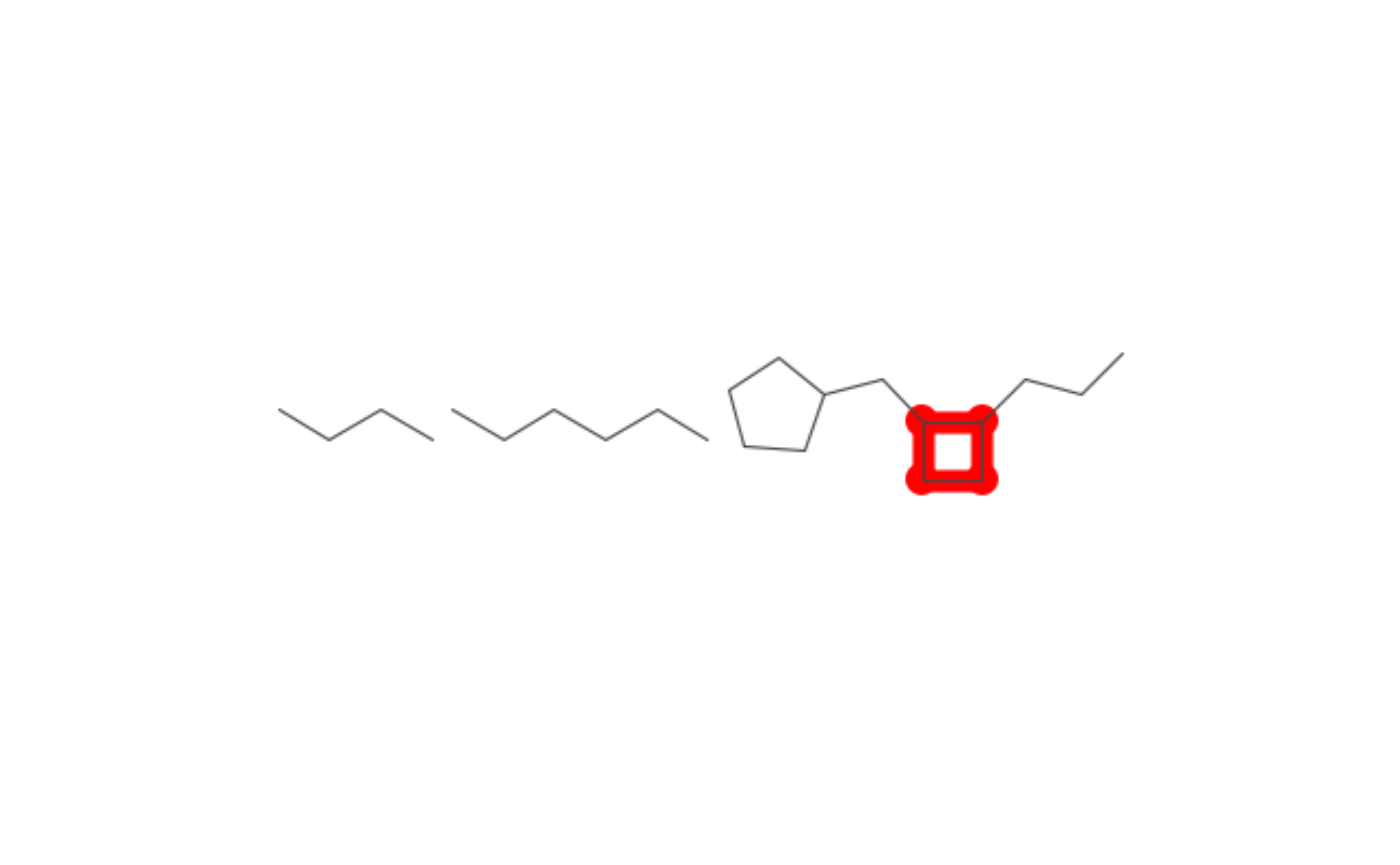
Multiple Colors
mol       <- parse_smiles(paste("CC(n1c(C)ncc1c1ccnc(n1)Nc1ccc(cc1)S(=O)(=O)C)C",
                                "CMGC:CDC2:6gu3:A:FB8", sep=" "))

# imid      <- 'c1cnc[nH]1'  #1H-imidazole
highlight_imid <- match_smarts("c1cncn1", mol)
highlight_2    <- match_smarts("n1cccnc1Nc2ccccc2", mol)

color <- J("java.awt.Color")

depiction() |>
  highlight_atoms(highlight_imid, color$GREEN) |>
  highlight_atoms(highlight_2, color$RED) |>
  set_size(400, 400) |>
  set_zoom(4) |>
  outerglow() |>
  add_title() |>
  depict(mol) |>
  get_image() |>
  grid::grid.raster()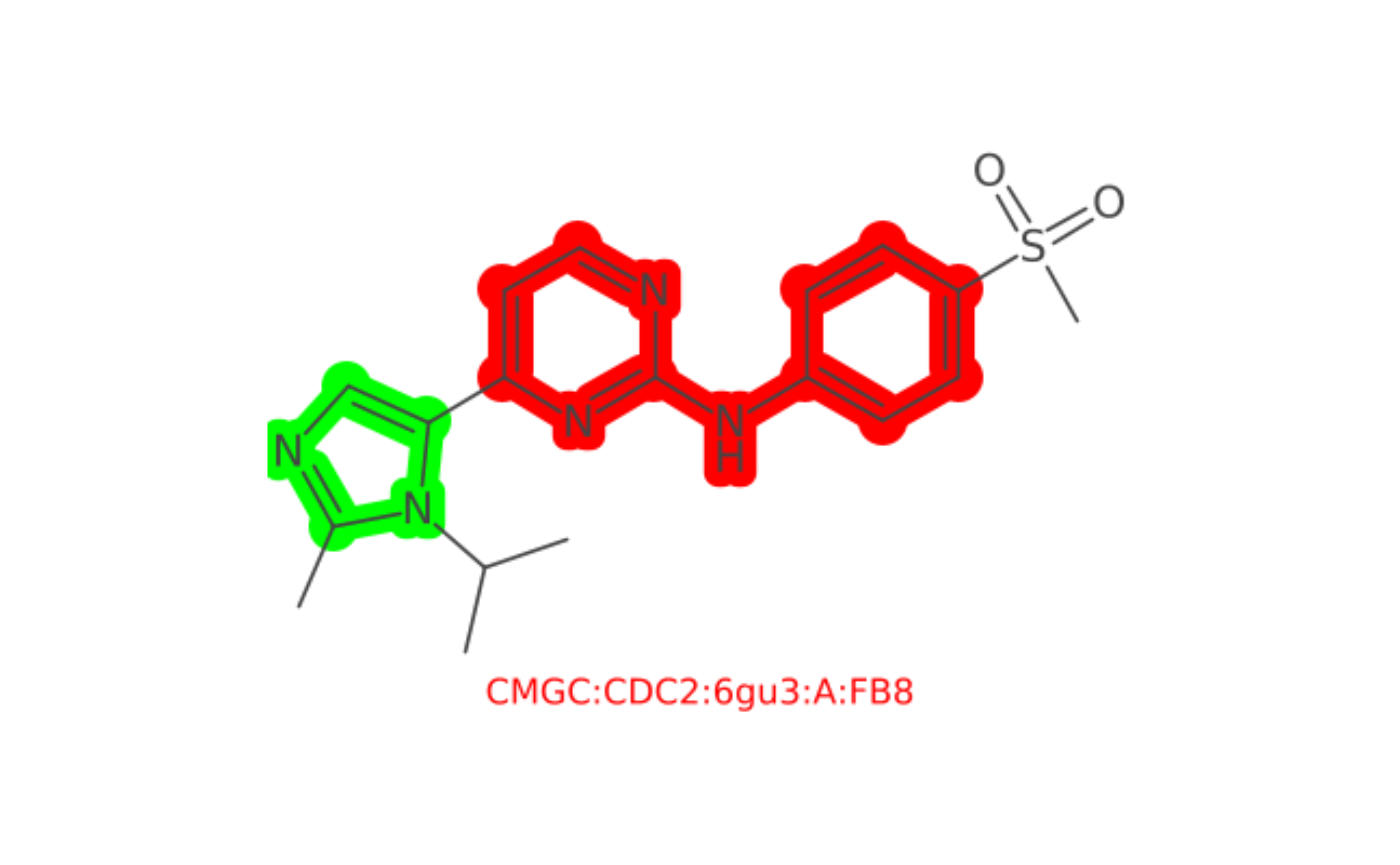
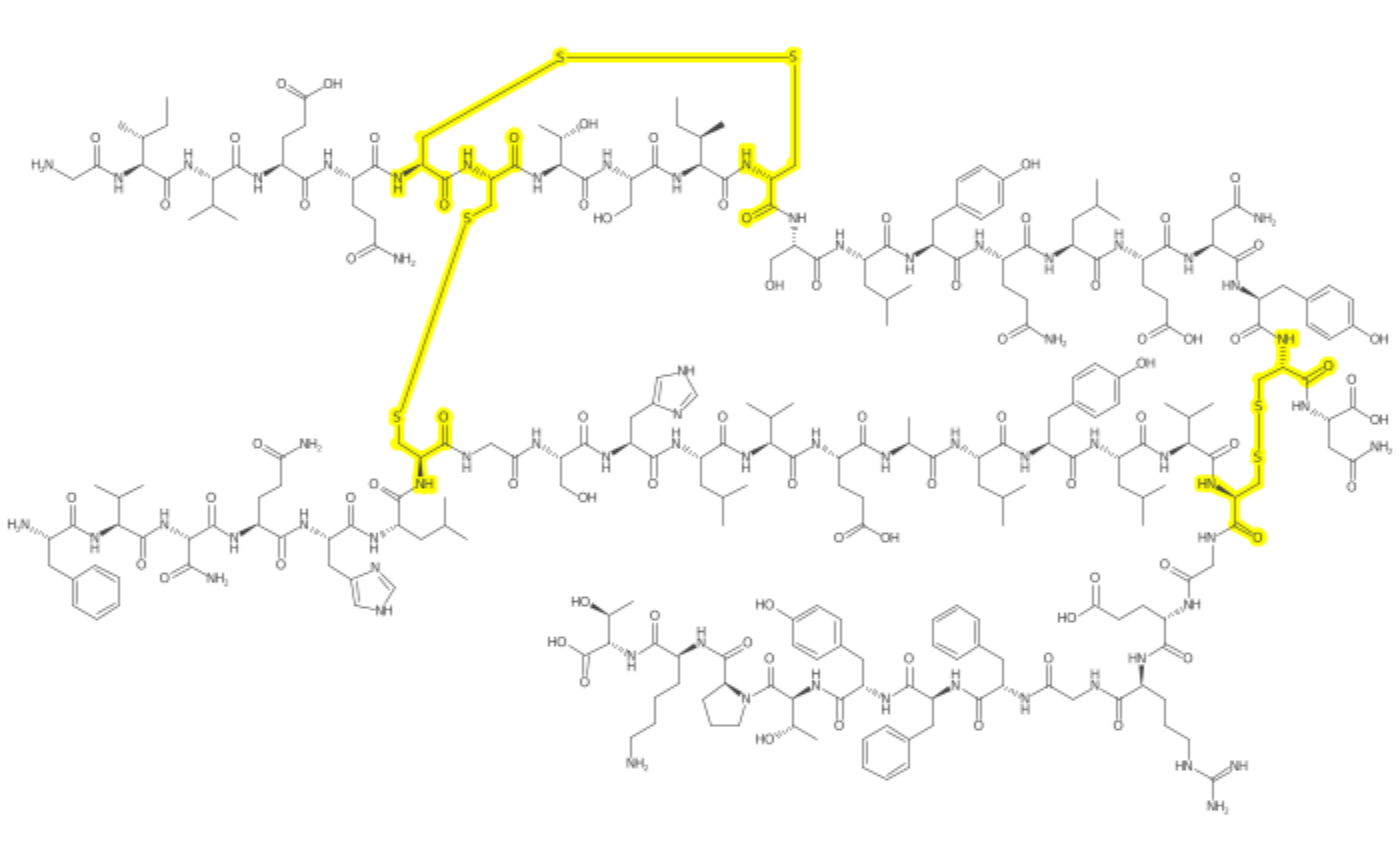
A Larger Example
# laoding a molfile
insulinmol <- system.file("molfiles/ChEBI_5931.mol", package="depict")
insulin    <- read_mol(insulinmol)

cysteine <- match_smarts("C(=O)C(CS)N", insulin)
xlinks   <- match_smarts("SS", insulin)

depiction()%>%
  set_size(700, 400) %>%
  set_zoom(10) %>%
  outerglow() %>%
  highlight_atoms(cysteine, color$YELLOW) %>%
  highlight_atoms(xlinks, color$YELLOW) %>%
  depict(insulin)%>%
  get_image() %>%
  grid::grid.raster()